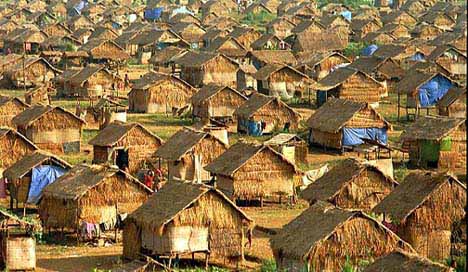
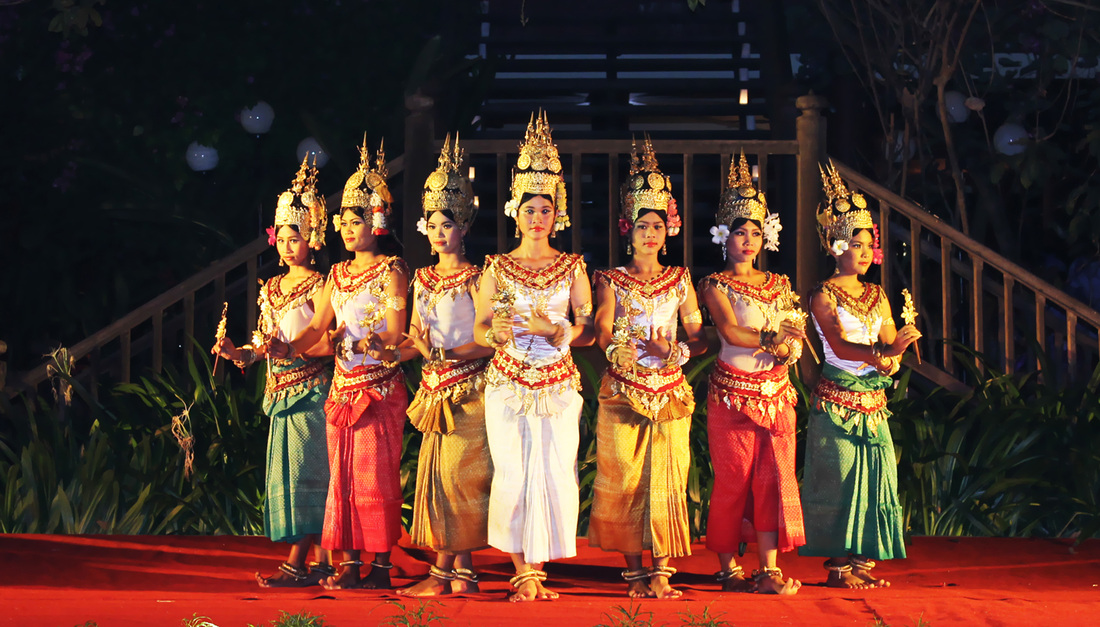
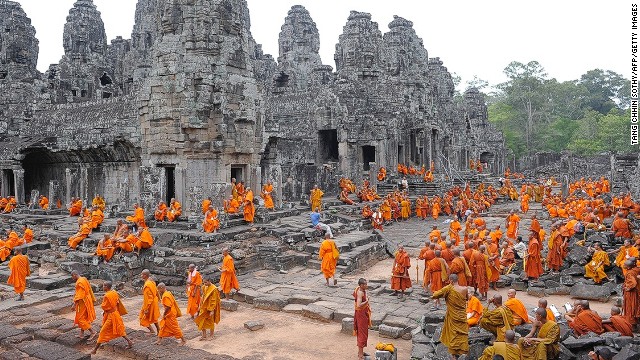
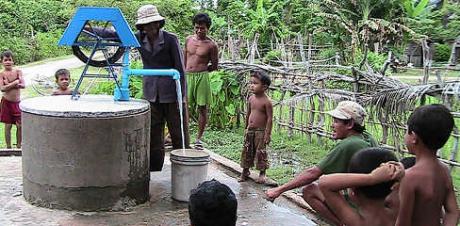
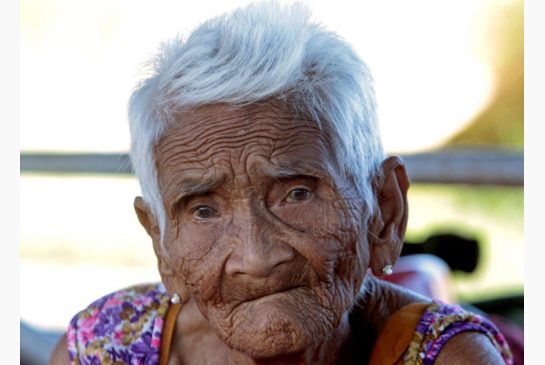
Cambodia is a developing country which is found in South-East Asia and is famous for its temples, dancing and the ruins of Angkor Wat at Siam Reap. Cambodia used to have lots of natural beauty but due to the Khmer Rouge it has been destroyed. The Capital city of Cambodia is Phnom Penh and poverty is a problem in Cambodia.

Population:
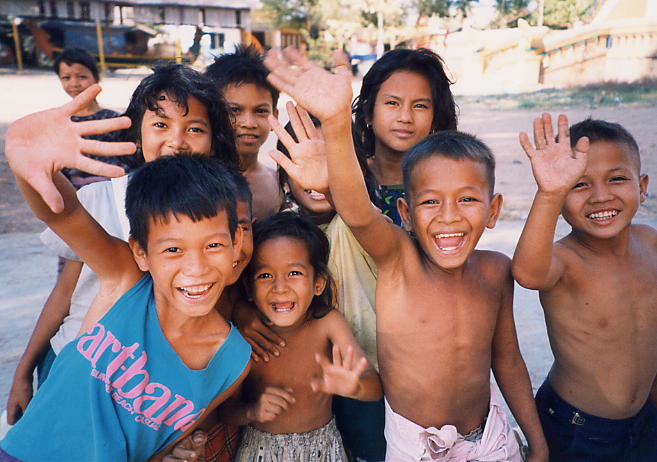
The population recorded at the end of June 2014 was 15, 003, 344.
Location:
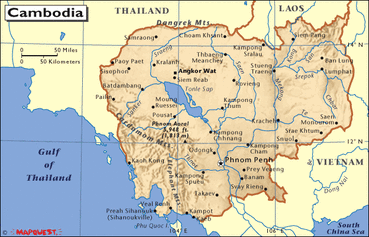
Cambodia is located in South-East Asia surrounded by Thailand, Laos, Vietnam and the Gulf of Thailand. the longitude and latitude of Cambodia is 11.5500° N, 104.9167° E. Cambodia is located in the northern hemisphere in the tropical zone making it quite warm and humid.
Statistics:
Below are two statistics for each of the following: economy, health, education and infrastructure. These statistics will be presented in a table and will have a brief explanation next to them saying what we can take from these statistics.
Health:
Below are two health statistics for Finland. The two I have selected are: life expectancy at birth and infant mortality rate (per 1,000 babies).
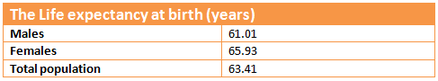
This table of statistics shows us that the average life expectancy at birth in Cambodia is 63.41 years old. This is quite a low average compared to Finland who's average is 75.55 years. We can also gather from this table that the females are expected to live longer than the males by 4.92 years. These statistics were recorded in 2013.
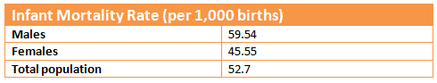
This table shows us that the average infant mortality rate in Cambodia is 52.7 babies per 1000 born. This number is a lot larger than Finland's which is 3.38 babies. also from this table we can learn that the male average is higher than the female average by 13.99 babies. These statistics were recorded in 2013.
Economy:
Below are two economy statistics for Cambodia. The two I have selected to looks at are: imports and exports and sectors.
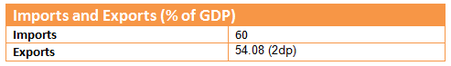
This table shows us that Cambodia earns a higher percentage of GDP from imports than it does from exports. The difference between the two is 5.92%. These statistics are higher than Finland's for both imports and exports. These statistics were recorded in 2011.
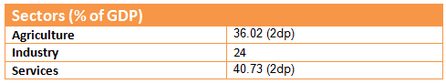
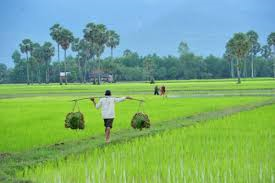
This table of statistics shows us that services make the highest percentage of GDP than industry and agriculture. Industry has the lowest percentage and agriculture is nearer to services. Like Finland the services have the highest percentage but there is a massive difference of 33.13% between the agriculture percentages. These statistics were recorded in 2010.
Infrastructure:
Below are two tables displaying statistics for the following topics under infrastructure for Cambodia. They are: sanitation facility access and drinking water sources.
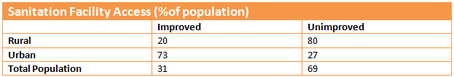
This table shows us that the urban areas have the most access to sanitation facilities at 73%. We also learn that only 20% of the population in rural areas have access to sanitation facilities. This is different to Finland because they have the whole population with access to sanitation facilities. These statistics were recorded in 2010.
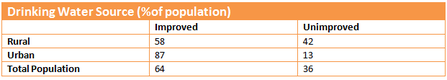
This table shows us that the urban areas have 87% of the population with access to a drinking water source. The rural areas have just over half of the population with access to a drinking water source at 58%. this is different to Finland because there they have the whole population with access to a drinking water source. These statistics were recorded in 2010.
Education:
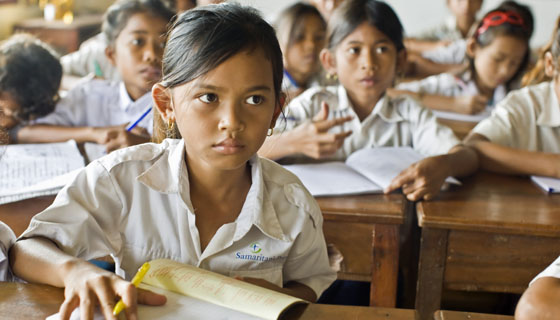
Below are two tables showing statistics relating to education in Cambodia. The two statistics I decided to look at are: primary completion rates and literacy.
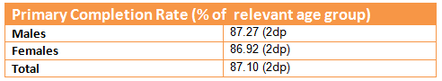
This table shows us that 87.10% of people complete primary school in Cambodia. There is a higher percentage of males who complete primary school by 0.35%. This is different to Finland because there is a difference between the amount of people who complete primary school by 11.09% and the fact that more males complete primary school than females in Cambodia. These statistics were recorded in 2010.
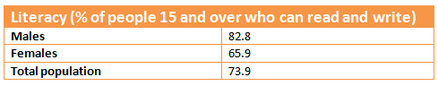
This table shows us that they percentage of people over the age of fifteen that can read and write is 73.9%. Also we learn that a higher percentage of males can read and write by 16.9%. This is different to Finland in the percentage of the amount of people who can read and write being 26.1% since everyone over fifteen in Finland can read and write. these statistics were recorded in 2009.
